How Bay Area Metros Are Really Performing: FHFA Home Price Index Q2 2025
The Federal Housing Finance Agency (FHFA) released its newest Top 100 Metro Area House Price Index for Q2 2025. Since the index is built from millions of real mortgage transactions, it offers one of the clearest views of how prices are shifting across U.S. metro areas. For Bay Area buyers and sellers—especially those in the $3M–$10M+ segment—this data provides a grounded look at long-term stability and short-term movement.
Below is a simple breakdown of how major Bay Area metros performed over the past 12 months and 5 years, and what those trends mean for high-end buyers.

Key Takeaways at a Glance
- One-year price growth has cooled, although
- Five-year appreciation remains strong, especially in core Silicon Valley.
- East Bay and nearby coastal markets like Oakland, Santa Cruz, and Napa outperformed the Peninsula on recent gains.
- San Francisco’s core metro division is essentially flat year-over-year, reflecting a mature, already-expensive market—not a downturn.
In short, noise in the last 12 months hasn’t changed the Bay Area’s long-term strength.
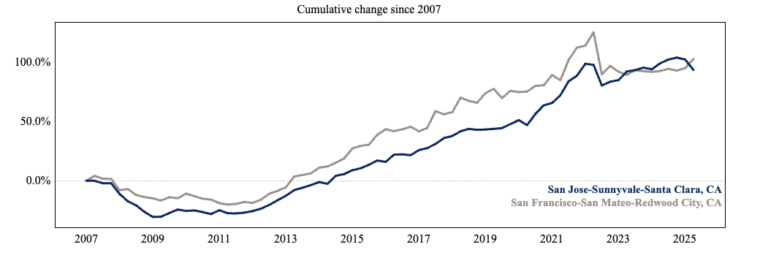
San Jose–Sunnyvale–Santa Clara (Core Silicon Valley)
- 1-Year Change: +1.69%
- 5-Year Change: +36.32%
San Jose remains one of the strongest high-cost markets in the country. Although year-over-year gains were mild, the five-year trend shows a rise of more than 36%, even after rate increases and tech-sector volatility.
What this means for a $3M–$8M buyer:
- Short-term: conditions are steady, not falling.
- Medium-term: Silicon Valley has behaved like a long-duration growth market—sensitive at times, but reliably upward over cycles.
- Practical takeaway: waiting for a dramatic “crash” has not paid off in this region for more than a decade.
San Francisco–San Mateo–Redwood City (Core Peninsula MSAD)
- 1-Year Change: +0.19%
- 5-Year Change: +17.99%
The Peninsula’s core metro posted nearly flat year-over-year growth. Prices are still up almost 18% over the last five years, although that trails other Bay Area regions with stronger demand for space.
What this suggests:
- The Peninsula is in a price-sensitive phase, typical of mature luxury markets.
- Upside is more selective, driven by the best locations, architectural quality, and turnkey condition.
- Buyers may find negotiation opportunities on homes with outdated layouts or deferred updates.
- For long-term owners, the Peninsula behaves like a capital-preservation market with selective upside—not a high-beta growth play.
Oakland–Fremont–Berkeley (East Bay MSAD)
- 1-Year Change: +3.38%
- 5-Year Change: +29.64%
The East Bay continues to outperform the Peninsula on both a one-year and five-year basis.
Why it’s happening:
- Buyers continue trading for more space, light, and land in exchange for slightly longer commutes.
- The East Bay has proven to be a value trade compared to the West Bay: strong appreciation with more flexible product types.
- For move-up buyers and investors, this area has become one of the region’s quieter long-term winners.

Santa Cruz–Watsonville (Coastal Lifestyle Market)
- 1-Year Change: +2.10%
- 5-Year Change: +32.58%
Santa Cruz–Watsonville behaves like a lifestyle-driven coastal market with durable demand from hybrid workers and Bay Area commuters.
Highlights:
- Posting positive gains during a high-rate year is notable.
- Five-year performance tracks closely with Silicon Valley, which is rare for a smaller coastal metro.
- Santa Cruz is no longer just a vacation-town market—it has become a long-term lifestyle asset connected to Bay Area employment.

Extended Northern California Markets
How secondary markets are performing.
Napa
- 1-Year: +4.22%
- 5-Year: +34.57%
Napa continues to behave like a luxury hospitality and second-home market, with strong sustained demand.

Santa Rosa–Petaluma
- 1-Year: –2.59%
- 5-Year: +28.32%
After a strong run, the region is cooling, though five-year gains remain substantial.
Vallejo
- 1-Year: +0.90%
- 5-Year: +32.42%
Vallejo benefits from affordability-driven spillover and continues to show solid appreciation.
Sacramento–Roseville–Folsom
- 1-Year: +1.72%
- 5-Year: +39.56%
Sacramento has become the region’s pressure valve—a top destination for buyers priced out of the core Bay Area. Its five-year performance rivals or surpasses Silicon Valley.
How I Use This Data With $3M–$10M Clients
Serious buyers don’t want hype—they want clarity. I use FHFA’s data to answer three core questions:
1. Is this market structurally strong or just in a temporary phase?
Five-year appreciation highlights where underlying demand is real versus momentary.
2. What’s the true downside risk?
Comparing one-year and five-year trends shows which metros already corrected—and which haven’t.
3. Is the price about narrative or genuine long-term fundamentals?
By comparing Silicon Valley, the Peninsula, the East Bay, and coastal rings, the data exposes where value is justified and where it’s simply expensive.
Bottom Line for Luxury Buyers
The Bay Area is not declining—it’s sorting. Product quality, micro-location, school zones, privacy, and land matter more than ever.
- Silicon Valley and select surrounding metros (Napa, Sacramento, Santa Cruz) still show strong long-term appreciation despite short-term volatility.
- For high-end buyers, this environment offers more room to evaluate, negotiate, and make rational, data-informed choices.
If you want a custom ZIP-level performance snapshot for neighborhoods you’re considering—Saratoga, Los Gatos, Los Altos Hills, Palo Alto, Cupertino, Menlo Park, or anywhere on the Peninsula—I can prepare a private, data-backed brief before you commit to a major purchase.