San Jose vs San Francisco Housing Market 2025 (FHFA Q2 Data Explained)
Which Bay Area Metro Is Stronger Right Now? A Luxury-Level Breakdown
The Bay Area housing market remains one of the strongest in the country, but performance varies significantly between the San Jose–Sunnyvale–Santa Clara metro and the San Francisco–San Mateo–Redwood City metro.
Using the FHFA House Price Index (Purchase-Only) for Q2 2025, this report explains how each market is behaving, why they differ, and what luxury buyers should know before investing in a $3M–$10M+ home.
Table of Contents
- San Jose vs San Francisco: YoY Home Price Change
- QoQ Price Change Comparison
- Long-Term Appreciation: 2007–2025
- YoY Volatility and Market Cycles
- Which Metro Is Better for Luxury Buyers?
- Expert Insights
- Request a Custom ZIP-Level Report
1. San Jose vs San Francisco: Year-Over-Year Home Price Change (2024Q2 → 2025Q2)
San Jose–Sunnyvale–Santa Clara (SJ Metro)
▼ –2.8% YoY
The SJ metro experienced a modest year-over-year correction, driven by selective buyer behavior and tighter affordability.
San Francisco–San Mateo–Redwood City (SF Metro)
▲ +5.2% YoY
The SF metro posted a surprising rebound, outperforming San Jose and indicating stronger demand for renovated and well-located Peninsula homes.
On a one-year basis, the two metros have diverged.
- San Jose–Sunnyvale–Santa Clara: –2.8% (modest decline)
- San Francisco–San Mateo–Redwood City: +5.2% (solid gain)
San Jose has given back a bit of recent appreciation, reflecting more price sensitivity and selectivity from buyers. The Peninsula, on the other hand, has seen a meaningful rebound as demand concentrates on renovated homes and top locations.
For a luxury buyer, that translates to:
- San Jose: more room to negotiate and better entry points on quality inventory.
- San Francisco Peninsula: stronger competition for well-positioned, move-in-ready homes.
Chart: YoY Price Change — San Jose vs San Francisco
source: fhfa.gov
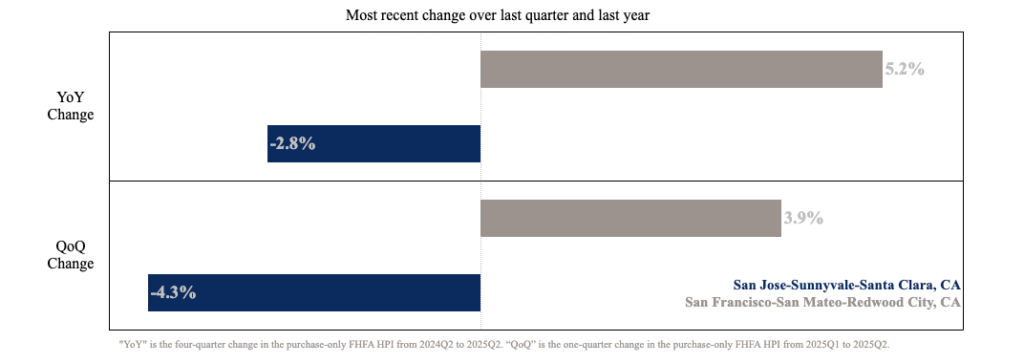
2. Quarter-Over-Quarter Price Change: Q1 → Q2 2025
San Jose Metro
▼ –4.3% QoQ
A short-term price dip and slower buyer urgency.
San Francisco Metro
▲ +3.9% QoQ
A strong Q2 rally as buyers re-enter the Peninsula luxury market.
Key takeaway:
- San Jose offers value windows → good for analytical buyers.
- San Francisco has renewed momentum → competitive for high-end renovated homes.
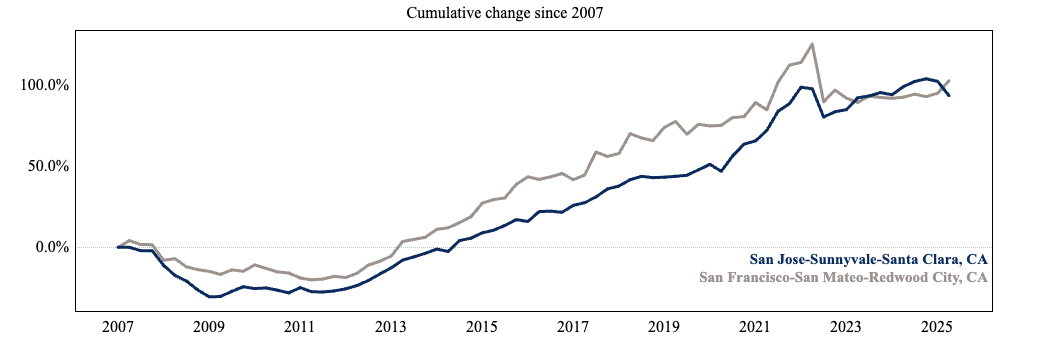
3. Long-Term Appreciation: 2007–2025 (18-Year View)
The FHFA cumulative appreciation chart shows:
- Both metros are up nearly 100% since 2007.
- SF historically outperformed, but
- San Jose caught up significantly in 2020–2022 and is now closely aligned.
- Long-term, both markets behave like low-volatility growth assets.
Chart: Cumulative Home Price Change (2007–2025)
source: fhfa.gov

4. Year-Over-Year Volatility (2007–2025): Which Metro Handles Cycles Better?
San Jose:
- More cyclical
- Higher highs and lower lows
- Strong recovery patterns
- More sensitivity to tech sector employment
San Francisco Peninsula:
- Smoother appreciation curve
- Less downside volatility
- Stable long-term price floor due to supply constraints
What this means for luxury buyers
- San Jose: better for those seeking upside and smart entry timing.
- Peninsula: better for those seeking long-term stability and prestige ZIP codes.
5. Which Metro Is Better for Luxury Buyers?
Choose San Jose if you value:
- Neighborhoods with strong long-term appreciation
- Larger lots, privacy, and newer construction
- Short-term value opportunities due to recent corrections
- Proximity to major tech campuses
Choose the Peninsula if you value:
- Walkability and lifestyle amenities
- Consistent buyer demand
- Top-tier public and private schools
- Historically stable appreciation
- Low supply + high prestige ZIP codes (94027, 94022, 94024, 94025)
Both markets remain elite — but for different reasons.
6. Expert Insight
When you zoom out, the data shows that both San Jose and the San Francisco Peninsula have been strong, durable markets over time. The current divergence—San Jose slightly down year-over-year and the Peninsula up—is an opportunity for thoughtful buyers, not a red warning light.
For many of my clients:
- San Jose is where they find value, land, and upside.
- The Peninsula is where they prioritize brand-name ZIP codes, walkability, and long-term stability.
The right answer depends on your time horizon, tolerance for volatility, and lifestyle priorities.
7. Request a Custom ZIP-Code Performance Report
This metro-level view is only the starting point. The real insights appear when you drill down into:
- Specific ZIP codes
- School districts
- Neighborhood pockets
- Lot types and product types (new builds vs. older stock)
If you’re considering a purchase in Saratoga, Los Gatos, Los Altos Hills, Palo Alto, Cupertino, Menlo Park, or nearby areas, I can prepare a private, data-driven brief comparing the ZIP codes you’re deciding between—using long-term price trends, recent behavior, and local on-the-ground context.
Request a confidential consultation to see the numbers behind the neighborhoods before you commit capital.